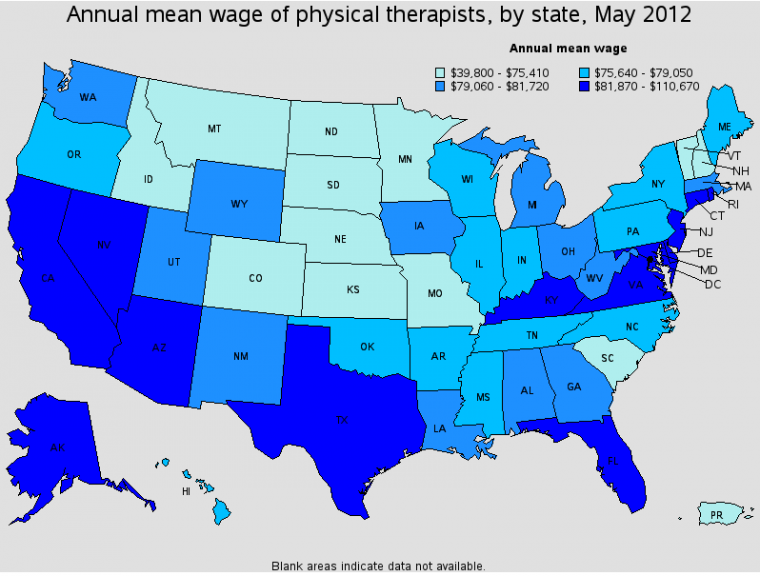
Here is a chart with the annual mean wage of physical therapists, by state from May 2012 from the US Department of Labor, Bureau of Labor Statistics.
For my staff… don’t get too excited, Texas’ wildly inflated salaries include such locations as my hometown of Amarillo, Texas and beautiful Nuevo Laredo, where a friend of mine will give you a six figure salary tomorrow.
My point is that you should take this information with a grain of salt. It includes all practice areas, experience and responsibility levels. For example, starting salaries in Austin, TX for outpatient physical therapy in a private practice setting are in the mid $50s. Unless you work in home health or are a manager of some kind you are unlikely to see $80s, much less the upper end of that register.
Oddly enough, Colorado was featured as the #2 state to be a PT in the article I mentioned here. Look for more of this kind of information coming soon under the category ‘Geography of PT’ - my new hobby.
Do these numbers seem real to YOU?


The numbers seem close to reasonable from what I’ve seen in my part of Texas. I know as a PT, with 4 years experience, I can easily get a job at a SNF or in some home health groups and be in the $90k region. I know because I’ve been offered more than once. While the numbers may seem great, the practice just isn’t my cup of tea. I wonder if this data is from reports of base salaries or if it includes the “extras” some PTs make..? Almost all the PTs I know in my region work full time, and they supplement with home health or SNF contracts. Those payment per visit/hour scenarios can add up quickly. Thanks for sharing this post. I look forward to following your posts.
Thanks Shannon… these are from the Bureau of Labor Statistics. You can drill way down into the counties and regions and different types of practices, but it is still difficult to tell what is going on without standard deviations and some of that sort of information. There is pretty wide variation even in outpatient practices, and they don’t include management vs. staff data. From what I can tell this would not include any benefits and it definitely wouldn’t include CE and other non compensation benefits.