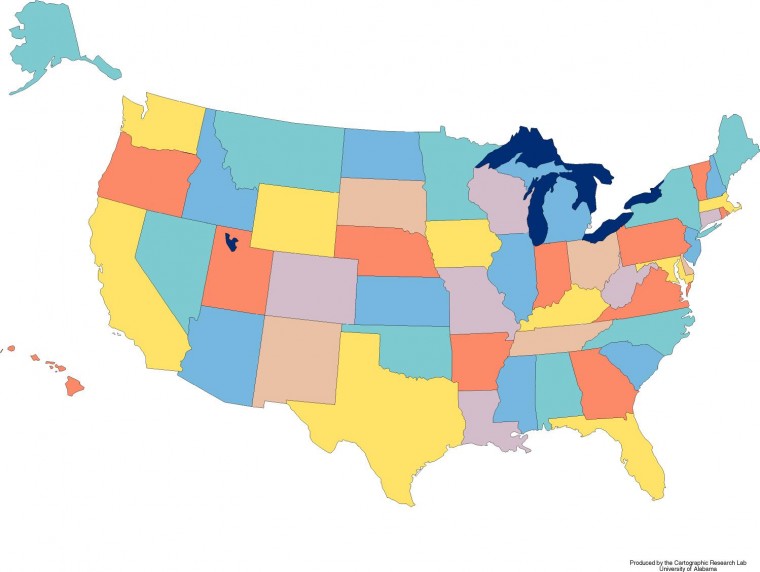
In October of 2013, the APTA’s monthly publication PTinMotion published an article which sounded like it was going to be really cool. Donald Tepper did an analysis of which states had the most to offer physical therapists and physical therapy assistants. The article was titled “The Best States in Which to Practice“. Rounding out the top 5 were:
- Utah
- Colorado
- Minnesota
- Virginia
- Idaho
My home state, Texas was at a respectable #12. The only thing I found odd is that there seems to be a virtual flood of PTs migrating from the two states at the top. My PT friends in Colorado all seem to be concerned that the decline in payment for services will take the salaries there even lower. When we lived in Virginia, the cost of living was so high, that I was surprised to see it on the list as well. It made me wonder… what went into this list? The criteria they used “after examining other similar lists and seeking input from state chapters” was 6 criteria:
- Well-being and future livability
- Literacy and health literacy
- Employment and employment projections (projected growth in PT jobs from 2010 to 2020)
- Business and practice friendliness
- Technology and innovation ranking
- PT and student engagement with APTA
This is where I get confused… why does this list read like it was put out by US News and World Report? Where are all the PT issues that APTA is advocating for in trying to reach Vision 2020? There are big differences in the states when it comes to the practice of physical therapy. Especially in the private practice world, where you practice can make all the difference. If it were me making the list of ‘Best States in Which to Practice’ this is the list I would use.
- Status of direct access legislation
- Payment for services and regulatory burden for a typical PT visit
- Licensure restrictions or lack thereof (Can I manipulate? Can I utilize trigger point dry needling?)
- Density of physician owned and hospital owned physical therapy services
- Cost of living index
- Median physical therapist salary
These are some of the things that impact how the business of physical therapy works. In Texas I receive almost double for the same services as my colleagues in New Jersey. At the same time median salaries also range from a little more than $26/hour to almost $38/hour depending on your state. I think that the payment for the service you provide or the salary you receive might be more important than the technology and innovation ranking for the state… at least in a list published by our professional organization. Financial aspects of well-being and professional concerns aren’t everything, but I find it nonsensical that a list published in our professional organization’s publication almost entirely failed to include them as important.
Note to self: Future blog post: ‘The Best States to Own a Private Practice’.
What’s on YOUR list? How does your state stack up when you use my list?
Lets discuss on twitter - #solvePT, Tues Nov. 19 at 8-9pm CST or lets discuss them in the comments below.


Great points David, your list makes way more sense.
This is a document published by APTA regarding direct access laws for all 50 states. http://bit.ly/1bC2RBN
It would be great to get more info for #2 and #3. I can speak to Florida and say that its the worst for POPTS in south Florida, but not too bad for licensing restrictions….we are working on some projects currently to expand our legal scope.
Great info, Eric! Thanks. I’ve got a nifty plugin that will let me build interactive maps - I just added that map (along with median income) to my list of ‘things to do’. The silent one I think is level of payment for services. It varies wildly and not well published.
We’re delighted that people continue to engage with this article, and we appreciate your critique. To come up with the initial criteria, we researched other “Best Places” surveys, polled all 50 APTA state associations, sought input from our editorial board, and more. Based on reader feedback to our first rating, we’re planning to make some changes in our approach to this national scan in future years.
However, I want to point out that several of the items on the “wish list” above were taken into consideration in our analysis, though in some cases weren’t mentioned explicitly. For example, the status of direct access legislation was one of two key factors included within “small business friendliness.” (Payment and regulatory burden were also considered in that category. Also, elements of licensure restrictions were addressed in the “technology and innovation” category-the state of telehealth laws, for instance. And the cost of living index was evaluated in conjunction with the median physical therapist salary in the “state well-being and future livability” analysis.
Again, we’re hoping to improve our approach moving forward, but those factors that you highly definitely had our attention and were not overlooked in this initial analysis.
Hi Donald, thanks for listening in and responding. Great to know these things were included to a degree in the more broad categories. To be fair, I see things through of PT private practice lens to some degree. I think the geography of PT is very interesting… the huge variability makes it so. I will look forward to seeing what you and your team can put together next year.